A large number of EU organisations already leverage Big Data pools to drive value and investments. This trend also applies to the banking sector. As a specific example, CaixaBank currently manages more than 300 different data sources (more than 4 PetaBytes of data and increasing), and more than 700 internal and external active users and services are processing them every day. In order to harness value from such high-volume and high-variety of data, banks need to resolve several challenges, such as finding efficient ways to perform Big Data analytics and to provide solutions that help to increase the involvement of bank employees, the true decision-makers. In this chapter, we describe how these challenges are resolved by the self-service solution developed within the I-BiDaaS project. We present three CaixaBank use cases in more detail, namely, (1) analysis of relationships through IP addresses, (2) advanced analysis of bank transfer payment in financial terminals and (3) Enhanced control of customers in online banking, and describe how the corresponding requirements are mapped to specific technical and business KPIs. For each use case, we present the architecture, data analysis and visualisation provided by the I-BiDaaS solution, reporting on the achieved results, domain-specific impact and lessons learned.
You have full access to this open access chapter, Download chapter PDF
Collection, analysis and monetisation of Big Data is rapidly changing the financial services industry, upending the longstanding business practices of traditional financial institutions. By leveraging vast data repositories, companies can make better investment decisions, reach new customers, improve institutional risk control and capitalise on trends before their competitors. But given the sensitivity of financial information, Big Data also spawns a variety of legal and other challenges for financial services companies. Footnote 1
Following this digitalisation trend, CaixaBank has been developing its own Big Data infrastructure since years and has been awarded several times (e.g. ‘2016 Best Digital Retail Bank in Spain and Western Europe’ by Global Finance). With almost 14 million clients across Spain (and Portugal under their subsidiary brand BPI), CaixaBank has a network of more than 5000 branches with over 40,000 employees and manages an infrastructure with more than 9500 ATMs, 13,000 servers and 30,000 handhelds. All those figures represent a massive amount of data collected every day by all the bank systems and channels, gathering relevant information of the bank’s operation from the clients, employees, third-party providers and autonomous machines. In total, CaixaBank has more than 300 different data sources used by their consolidated Big Data models and more than 700 internal and external active users enriching their data every day, which is translated into a Data Warehouse with more than 4 PetaBytes (PBs), which increases by 1 PB per year.
Much of this information is already used in CaixaBank by means of Big Data analytics techniques, for example, to generate security alerts and prevent potential frauds—CaixaBank faces around 2000 attacks per month. However, CaixaBank is one of the banking leaders in the European and national collaborative research, taking part in pre-competitive research projects. Within the EU I-BiDaaS project (funded by the Horizon 2020 Programme under Grant Agreement 780787), CaixaBank identified three concrete use cases, namely (1) analysis of relationships through IP addresses, (2) advanced analysis of bank transfer payment in financial terminals and (3) Enhanced control of customers in online banking to study the potential of a Big Data self-service solution that will empower its employees, who are the true decision-makers, giving them the insights and the tools they need to make the right decisions in a much more agile way.
In the rest of this chapter, Sect. 2 discusses the requirements and challenges for Big Data in the banking sector. Section 3 details the different use cases considered, together with their technical and business KPIs. In Sect. 4, for each use case, we present the architecture, data analysis and visualisation of the I-BiDaaS solution, reporting on the achieved results and domain-specific impact. It also relates the described solutions with the BDV reference model and priorities of the BDV Strategic Research and Innovation Agenda (SRIA) [1]. Section 5 summarises the lessons learned through all the experiments deployed by CaixaBank and the rest of I-BiDaaS partners, especially on how to handle data privacy and how to iteratively extend data usage scenarios. Finally, Sect. 6 presents some conclusions.
The vast majority of banking and financial firms globally believe that the use of insight and analytics creates a competitive advantage. The industry also realises that it is sitting on a vast reservoir of data, and insights can be leveraged for product development, personalised marketing and advisory benefits. Moreover, regulatory reforms are mainly leading to this change. Ailing business and customer settlements, continuous economic crisis in other industry verticals, high cost of new technology and business models, and high degree of industry consolidation and automation are some of the other growth drivers. Many financial services currently focus on improving their traditional data infrastructure as they have been addressing issues such as customer data management, risk, workforce mobility and multichannel effectiveness. These daily problems led the financial organisation to deploy Big Data as a long-term strategy and it has turned out to be the fastest growing technology adopted by financial institutions over the past 5 years. Footnote 2
Focusing on the customer is increasingly important and the critical path towards this direction is to move the data analytics tools and services down to the employees with direct interaction with the customers, utilising Big-Data-as-a Self-Service solutions Footnote 3 [2].
Another critical requirement for financial organisations is to use data and advanced analytics for fraud and risk mitigation and achieving regulatory and compliance objectives. With cyber security more important than ever, falling behind in the use of data for security purposes is not an option. Real-time view and analysis are critical towards competitive advantage in the financial/banking sector.
The usage of Big Data analytics is gradually being integrated in many departments of the CaixaBank (security, risks, innovation, etc.). Therefore, there is a heterogeneous group of experts with different skills but the bank also relies on several Big Data analytics experts that provide consultancy services. However, the people working with the huge amount of data collected from the different sources and channels of CaixaBank can be grouped into the following categories (which indeed could be fairly generalised to other financial entities):
Although ‘IT and Big Data expert users’ are getting more involved and being a relevant part of the day-by-day business operations of the entity, there are few compared to the ‘Intermediate’ and ‘Non-IT users’. Reducing the barriers and the knowledge required by those user categories in exploiting efficiently the collected data represents one of the most relevant challenges for CaixaBank.
With all this, the I-BiDaaS methodology for eliciting CaixaBank requirements (see Table 1) took into consideration the specific challenges faced by CaixaBank, as well as the literature on Requirements Engineering (RE) approaches specifically for Big Data applications [3].
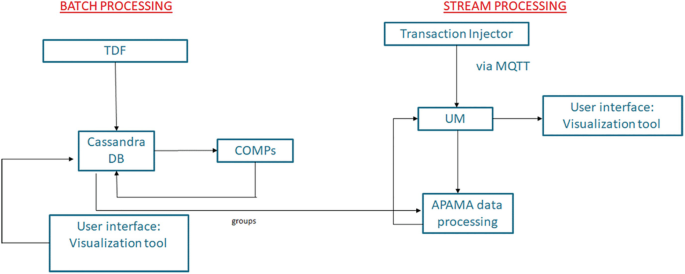
The batch processing subcase starts with the creation of a file of realistic synthetic data in SQLite format (TDF component Footnote 5 ), which is then imported in a Cassandra Database, which is specifically used for its distributed properties, and COMPSs [8] with Hecuba Footnote 6 are used to run the analysis. In the streaming subcase, transactions of users are created and published via the Message Queuing Telemetry Transport (MQTT) protocol (Universal Messaging), and later an APAMA Footnote 7 GPU-enabled data processing application loads the data analysis created in the batch subcase, and compares any data coming from the stream to it, generating a new message if there is a match. 3D data analysis through visualisation is also available via the Qbeast tool [9].
The rationale for using realistic synthetic data (TDF component in Fig. 1) is that technology development and testing processes can be simplified and accelerated, before or in parallel with carrying out the processes of making real data available (e.g. a tedious data tokenisation process). The incorporation of realistic synthetic data is done with care and is subject to data quality assessment (see Sect. 4.1.2) An operational-ready solution then replaces the realistic synthetic data with the corresponding real, tokenised data, as described in the subsequent sections.
In this first use case, we tried to evaluate the usage of fabricated data, which was created using TDF according to a set of rules defined by CaixaBank. The rules were refined several times in order to create realistic data for all different fields considering the format of the real data. It is difficult to distinguish a data sample from a field in the synthetic dataset and a sample from the same field in the real dataset. Some properties were difficult to model as constraint rules, e.g. the concrete time connectivity patterns that the real data follows, and thus they were not included in the specification of the synthetic dataset. Constraints for parameters which were not critical for the relationship analysis that was performed in the use case were sometimes relaxed as long as they allowed the synthetic dataset to remain valid for assessing that there exist the same percentage of relationships as in the real dataset.
The goal of the case is to find relations between people, given a set of connections to IP addresses, maximising the detection of close relations between users. This application has been implemented using the COMPSs programming model and Hecuba as the data interface with the Cassandra database.
We have defined several parallel tasks, not only to exploit parallelism but also to benefit from the automatic detection of the dependencies from COMPSs. Using Cassandra to store the data allows us to delegate on the database the management of the global view of the data. This approach frees programmers from implementing an explicit synchronisation between those parallel tasks that modify the data structure. This way, removing the synchronisation points, we are able to maximise the parallelism degree of the application and thus the utilisation of the hardware resources. Notice that the interface for inserting data in Cassandra is asynchronous with the execution of the application, this way overlapping data storage with computation.
The approach to solve this implementation has been to define a clustering-based analysis of CaixaBank’s IP address connections using a synthetic dataset. The purpose of the analysis is to provide additional modelling possibilities to this CaixaBank’s use case. The obtained results should be understood relative to the fact that the data set utilised is synthetic, even though the initial feedback from CaixaBank about the usefulness of the developed process is positive, and the approach is promising. The data set contains 72,810 instances, with each instance containing the following attributes:
Initially, the dataset is transformed as follows: each user represents a sample, while each IP address represents a feature. In such a data matrix, the value in position (i, j) represents the number of times user i connected via IP address j. Such a dataset turns out to be extremely sparse. In order to tackle this problem and retain only meaningful data, the next pre-processing step is to drop all the IP addresses that were used by only one user (intuitively, such IP addresses represent home network, etc. and thus cannot be used to infer relationships between users). After dropping all such IP addresses, 1075 distinct IP addresses remain from the initial 22,992 contained in the original dataset. Subsequently, we filter out the users that are not connected to any of the remaining IP addresses.
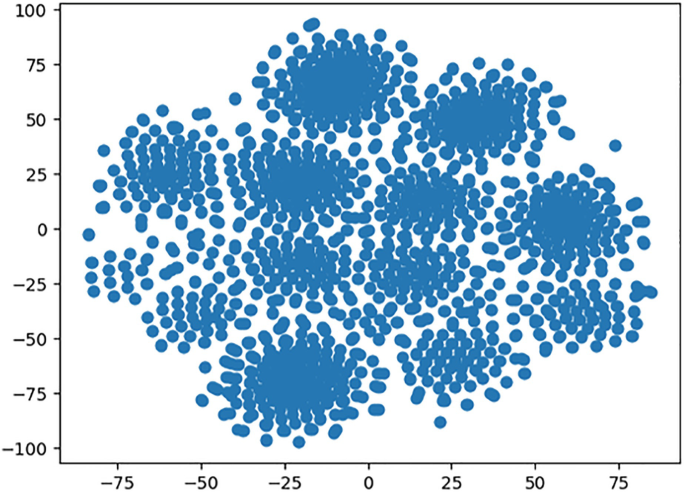
To infer relationships between users, we applied clustering algorithms. In particular, we used K-means [10] and DBSCAN [11], which are both available in the dislib library [12]. Additionally, we used the t-distributed Stochastic Neighbour Embedding (t-SNE) method [13] to visualise the reduced dataset in 2D. The visualisation is presented in Fig. 2.
Both K-means and DBSCAN offer some interesting hyperparameters. In particular, K-means allowed us the flexibility of setting the desired number of clusters. A preset number of clusters could be a limitation, especially in an exploration phase. However, the possibility to set up the number of clusters allowed us to define them according to the number of authentication mechanisms, for example, which was useful in the analysis of the use case. On the other hand, DBSCAN decides on the number of clusters internally while providing us with the parameters that represent the minimum number of samples in a neighbourhood for a point to be considered a core point, and the maximum distance between two samples for them to be considered as in the same neighbourhood. These parameters are to be set by an end-user based on experimentation and domain knowledge and are tuneable through the I-BiDaaS user interface.
Moreover, the evaluation of this use case was especially focused on analysing the validation of fabricated data for identifying patterns and number of connections. Therefore, a more advanced analysis with K-means and DBSCAN was done using both, the synthetic dataset and a tokenised version of a real dataset. The data tokenisation process included the encryption of all the fields of the dataset. The analysis performed over this dataset allowed the inference of conclusions and relationships in the real non-encrypted data.
The visualisation of the use case includes several graphic types. First, a graph shows the distribution of relationships detected based on their IP addresses (Fig. 3a).
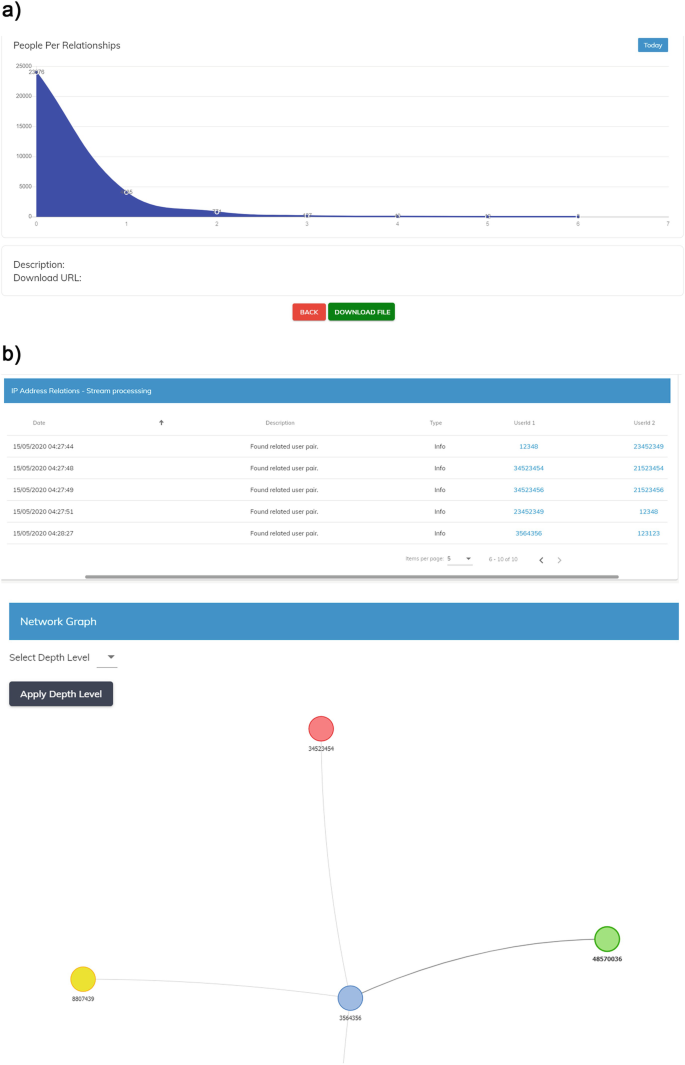
Using these relationships, visualisation of real-time bank transfers in the form of a continuous stream of sender-receiver records is used to emulate real-time detection of possibly fraudulent transactions (Fig. 3b). The visualisation utilises the previously detected relationships to display a graph of connected users so as to aid operators in determining possible relationships between users and decide whether further actions should be taken.
Results obtained from both real tokenised data and the synthetic data using those algorithms showed that the majority of the clusters found were 2-point clusters, indicating a good similarity for this use case.
An additional evaluation process was performed to determine a specific utility score, i.e. the similarity of results of analyses from the synthetic data and the original data. The propensity mean-squared-error (pMSE) was used as a general measure of data utility to the specific case of synthetic data. As specific utility measures we used various types of data analyses, confidence intervals overlap and standardised difference in summary statistics, which were combined with the general utility results (Fig. 4).
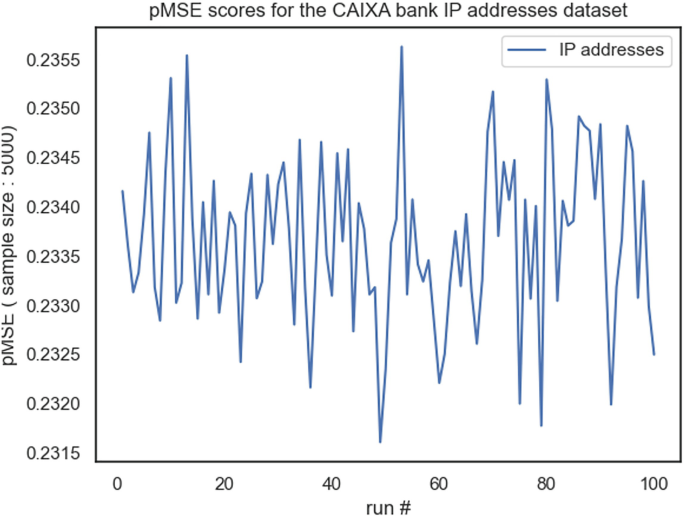
By randomly sampling 5000 datapoints from real and synthetic datasets, and using logistic regression to provide the probability for the label classification, we were able to show that the measured mean pMSE score for the ‘analysis of relationships through IP addresses’ dataset is 0.234 with a standard deviation of 0.0008.
Those quantitative results showed that the fabricated data is objectively realistic to be used for testing the use case. However, the rule-generation process that involves the data fabrication through TDF can be complex and long in other cases in which the knowledge of the data is not complete or the extraction of rules through statistical analysis is not clear.
The architecture (i.e. the specific components of the I-BiDaaS general architecture) in this use case is the same as the one described in Sect. 4.1.1, focused on the batch processing part. Therefore, what essentially changes are the algorithms used for processing the data (i.e. the bank transfers conducted by employees on their financial terminals). These algorithms will be described in the next sections.
This CaixaBank use case is focused on advanced analysis of bank transfers executed by employees on financial terminals to detect possible fraud, or any other potential anomalies that differ from the standard working procedure. The used dataset is composed of different attributes which record the different steps that the employee performs and other important data such as the account, client or amount of money transferred. All the data is encrypted using the Dice Coefficient [14], which codifies the data without losing important information.
All data processing techniques, like the K-means, PCA (Principal Component Analysis) [15] and DBSCAN have been performed using the dislib library. Also, the data structure used by dislib has been modified to be stored on a Cassandra Database using the Hecuba library.
The received dataset must be pre-processed before using the data transformation techniques from dislib. First, the attributes which contained the same value for all the registers have been deleted, as they do not give any relevant information. Also, all nulls and blank registers have been transformed into 0 values. Finally, for those categorical attributes, we transform the variable categories into columns (1, 0), a transformation known as one-hot encoding [16].
Due to the encoding transformations, the number of attributes has increased considerably from 89 to 501. This large amount of attributes made it difficult to perform K-means, and for this reason, it was decided to apply a PCA transformation to reduce the number of dimensions to 3, to also be able to represent it graphically. Before applying the PCA transformation, and due to the differences in the magnitude of the attributes, we have standardised the data using the scikit-learn method StandardScaler.
Finally, we have executed two different clustering algorithms: DBSCAN and K-means. As K-means requires the desired number of clusters as an input parameter, we have executed first DBSCAN and we have used the obtained number of clusters as the input parameter of K-means.
For this use case, a 3D graph of the data and detected anomalies has been developed. Users can select parts of the graph to focus on and can also extract the specific data samples that are included in the selection (Fig. 5).
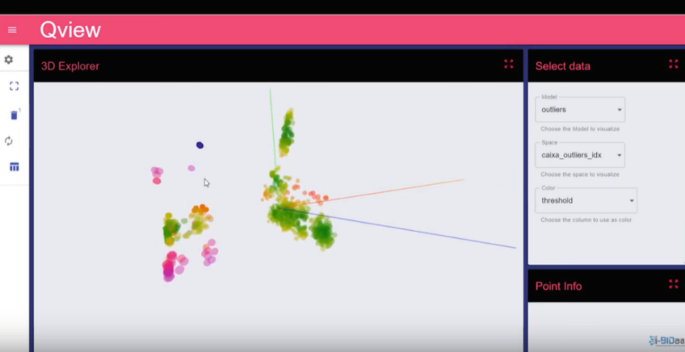
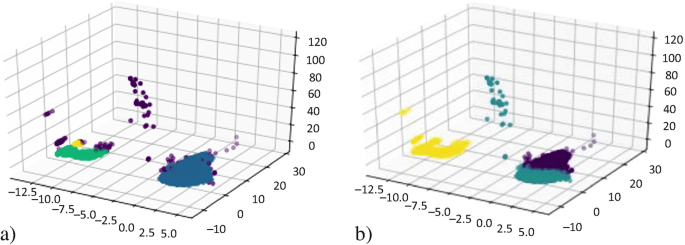
Figure 6a shows the graphical representation of the clusters generated by DBSCAN in a three-dimensional space, where the third dimension of the PCA is shown as the Z-axis. The result of K-means can be examined in Fig. 6b, we can observe that some values in the Z-axis are far away from the main cluster and, thus, are potential anomalies in the data.
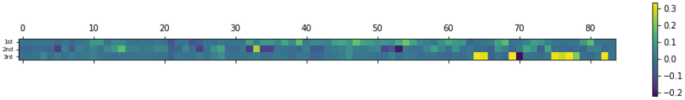
The PCA reduced the attributes from 501 to 3, thus it is difficult to understand which is the correlation between the resultant three dimensions and the 501 original attributes. In Fig. 7, we have printed the mentioned correlation. We only show the first 84 because they are the most interesting with respect to the third dimension of the Z-axis. We can appreciate that this third dimension is heavily influenced by attributes from 64 to 82.
As in Sect. 4.2.1, the set of components used to analyse bank transfers which were executed using online banking options (both web and mobile app) are the same as the ones described in Sect. 4.1.1, also with a main focus on the batch processing part, and selecting a different set of algorithms to analyse the data, as will be described in the following sections.
Following the objective of the use case in Sect. 3.3, this use case tried to identify useful patterns of mobile-to-mobile bank transfers and enhance current cybersecurity mechanisms by identifying if there is a set of transactions in which the level of security in the authentication process should be increased. For that reason, we decided to analyse a dataset collecting the information of all mobile-to-mobile bank transfers from clients for a month and work on non-supervised methods such as clustering. That cluster was done on a categorical database so that most known algorithms lost efficacy. The first attempt was to apply a K-means. However, since the vast majority of available variables were not numerical, calculating the distances for grouping in K-means algorithm was no longer so simple (e.g. if there are three types of enhanced authentication, should the distance between them be the same? Should it be greater since some of them are more restrictive than the others?). This type of question affects the result of the model; therefore, a transformation was made to the data. We applied one-hot encoding [16]. This transformation allowed to eliminate the problems of calculating the distance between categories. Even so, the results were not satisfactory. Given the situation, a search/investigation process was carried out for an appropriate model for this case series. We find the k-modes library that includes algorithms to apply clustering on categorical data.
The k-modes algorithm [17] is basically the already known K-means, but with some modification that allows us to work with categorical variables. The k-modes algorithm uses a simple matching dissimilarity measure to deal with categorical objects, replaces the means of clusters with modes, and uses a frequency-based method to update modes in the clustering process to minimise the clustering cost function.
Once the algorithm has been decided, we must calculate the optimal number of clusters for our use case. For this, the method known as the elbow method is applied, which allows us to locate the optimal cluster as follows. We first define:
Then we iterated the values of k from 1 to 10 and calculated the values of distortion for each value of k and calculated the distortion and inertia for each value of k in the given range. The idea is to select the number of clusters that minimise inertia (separation between the components of the same cluster) (Fig. 8).
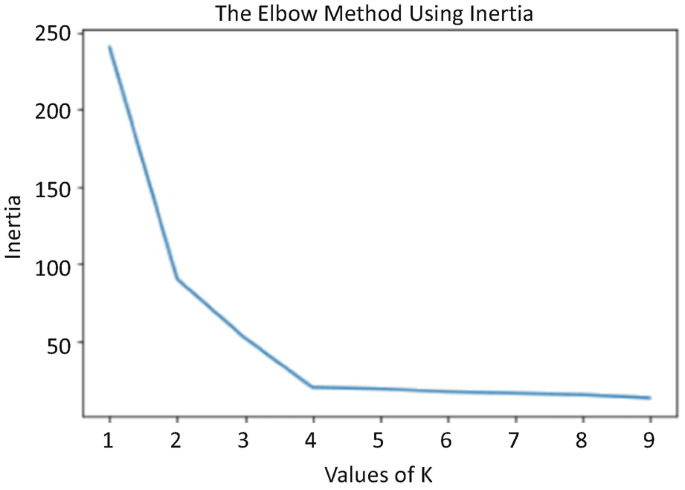
To determine the optimal number of clusters, we had to select the value of k at the ‘elbow’ in the point after which the distortion/inertia starts decreasing in a linear fashion. Thus, for the given data, we conclude that the optimal number of clusters for the data is 4. Once we know the optimal number of clusters, we apply k-modes with k = 4 and analyse the results obtained.
A dynamically updated chart depicting the clusters in which the monitored transactions fall into was used for this use case. The number of clusters is automatically updated to reflect new ones being detected by the processing pipeline (Fig. 9).
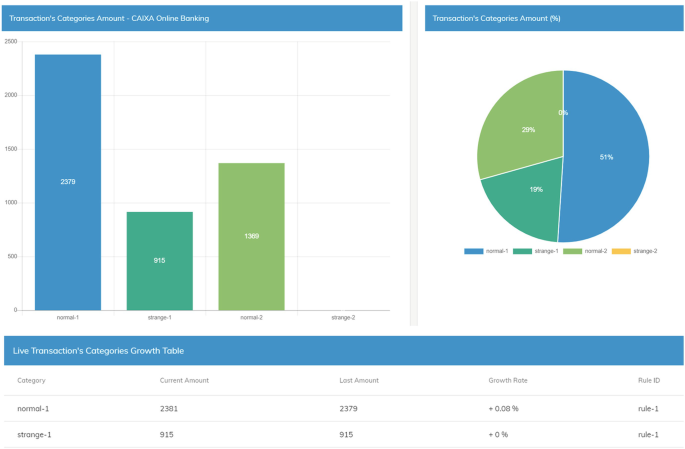
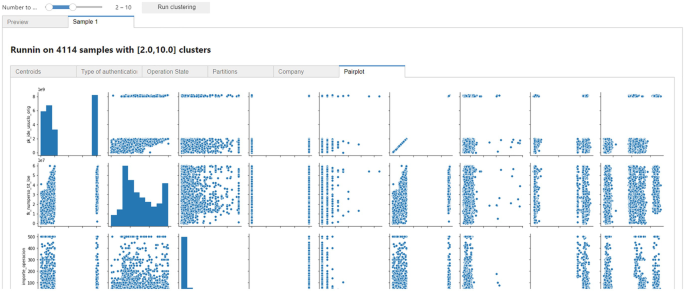
With this use case, I-BiDaaS allowed CaixaBank’s ‘Intermediate users’ and ‘Non-IT users’ to modify the number of clusters and run the algorithm over a selected dataset of transactions in a very fast and easy way. It was used for exploring clients’ mobile-to-mobile transaction patterns, identifying anomalies in the authentication methods and potential frauds, allowing fast and visual analysis of the results in the platform (Fig. 10).
The results were checked with the Digital Security and Security Operation Centre (SOC) employees from CAIXA in order to correctly understand if the clustering algorithm applied allowed to identify potential errors in our automated authentication mechanisms in mobile-to-mobile bank transfers. The obtained clusters of entries were useful to identify the different mobile-to-mobile bank transfers patterns and reconsider the way we are selecting the authentication method to proceed with the transfer. I-BiDaaS tools made it easier for the SOC employees and Digital Security department to analyse and identify bank transfer patterns in which a higher level of security would be beneficial. The rules on the authentication mechanism application for those patterns were redefined, applying a more restrictive authentication mechanism in around 10% of the mobile-to-mobile bank transfers (in a first iteration).
The described solution can be contextualised within the BDV Reference Model defined in the BDV Strategic Research and Innovation Agenda (BDV SRIA) [1] and contributes to the model in the following ways. Specifically, the work is relevant to the following BDV Reference Model horizontal concerns:
Regarding the BDV Reference Model vertical concerns, the work is relevant to the following:
Therefore, in relation to BDV SRIA, we contribute to the following technical priorities: data protection, data processing architectures, data analytics, data visualisation and user interaction.
Finally, the chapter relates to the following cross-sectorial technology enablers of the AI, Data and Robotics Strategic Research, Innovation and Deployment Agenda [18], namely: Knowledge and Learning, Reasoning and Decision Making, and Systems, Methodologies, Hardware and Tools.
CaixaBank, as many entities in critical sectors, was initially very reluctant to use any Big Data storage or tool outside its premises. To overcome that barrier, the main goal of CaixaBank when enrolling in the I-BiDaaS project was to find an efficient way to perform Big Data analytics outside its premises, which would speed up the process of granting new external providers to access CaixaBank data (which usually encompasses a bureaucratic process that takes weeks or even a month). Additionally, CaixaBank wanted to be much more flexible in the generation of proof-of-concept (PoC) developments (i.e. to test the performance of new data analytics technologies to be integrated into its infrastructure). Usually, for any new technology testing, even a small test, if any hardware is needed to be arranged, it should be done through the infrastructure management subsidiary who will finally deploy it. Due to the size and level of complexity of the whole CaixaBank infrastructure and rigid security assessment processes, its deployment can take months.
For those reasons, CaixaBank wanted to find ways to bypass these processes without compromising the security of the entity and the privacy of its clients. General Data Protection Regulation (GDPR) Footnote 8 really limits the usage of the bank customers’ data, even if it is used for potential fraud detection and prevention and for enhancing the security of its customers’ accounts. It can be used internally to apply certain security policies, but how to share this data with other stakeholders is still an issue. Furthermore, bank sector is strictly regulated, and National and European regulators are supervising all the security measures taken by the bank in order to provide a good level of security for the entity and, at the same time, maintain the privacy of the customers at all times. The current trend of externalising many services to the cloud also implies establishing a strict control of the location of the data and who has access to it for each migrated service.
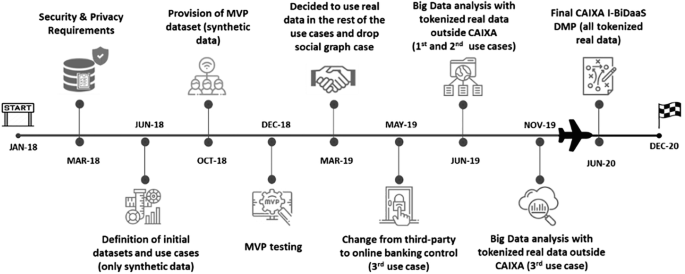
The I-BiDaaS CaixaBank roadmap (Fig. 11) had a turning point, in which the entity completely changed its approach from a non-sharing real data position to looking for the best way possible to share real data and perform Big Data analytics outside its facilities. I-BiDaaS helped to push for internal changes in policies and processes and evaluate tokenisation processes as an enterprise standard to extract data outside their premises, breaking both internal and external data silos.
Results obtained from the first use case validated the usage of rule-based synthetically generated data and indicated that it can be very useful in accelerating the onboarding process of new data analytics providers (consultancy companies and tools). CaixaBank validated that it could be used as high-quality testing data outside CaixaBank premises for testing new technologies and PoC developments, streamlining grant accesses of new, external providers to these developments, and thus reducing the time of accessing data from an average of 6 days to 1.5 days. This analysis was beneficial for CaixaBank purposes, but it was also concluded that the analysis of rule-based fabricated data did not enable the extraction of new insights from the generated dataset, simply the models and rules used to generate the data.
The other two use cases focused on how extremely sensitive data can be tokenised to extract real data for its usage outside CaixaBank premises. By tokenising, we mean encrypting the data and keeping the encryption keys in a secure data store that will always reside in CaixaBank facilities. This approach implied that the data analysis will always be done with the encrypted data, and it can still limit the results of the analysis. One of the challenges of this approach is to find ways to encrypt the data in a way that it loses as little relevant information as possible. Use case 2 and use case 3 experimentation was performed with tokenised datasets built by means of three different data encryption algorithms: (1) format-preserving encryption for categorical fields, (2) order-preserving encryption for numerical fields and (3) a bloom-filtering encryption process for free text fields. This enabled CaixaBank to extract the dataset, upload it to I-BiDaaS self-service Big Data analytics platform and analyse it with the help of external entities without being limited by the corporate tools available inside CaixaBank facilities. I-BiDaaS Beneficiaries proceeded with an unsupervised anomaly detection in those use cases, identifying a set of pattern anomalies that were further checked by CaixaBank’s Security Operation Center (SOC), helping to increase the level of financial security of CaixaBank. However, beyond that, we consider this experimentation very beneficial, and should be replicated in other commercial Big Data analytics tools, prior to their acquisition.
The main benefits obtained by CaixaBank due its participation in I-BiDaaS (highlighted in Table 2) directly relate to the evaluation of the different requirements presented in Sect. 2 (Table 1).
Table 2 Summary of the impact of the CaixaBank use cases studied in I-BiDaaSWe were able to speed up the implementation of Big Data analytics applications (R1), test algorithms outside CaixaBank premises (R2) and test new tools and algorithms without data privacy concerns by exploring and validating the usage of synthetic data and tokenised data (R3) in three different use cases, improving the efficiency in time and cost (R5, R6, R7) by means of skipping some data access procedures and being able to use new tools and algorithms in a much more agile way. User requirements regarding the availability of ‘Intermediate and Non-IT users’ to analyse and process the data of the use cases were also validated through several internal and external workshops Footnote 9 in which the attendees from several departments of CaixaBank and other external entities (data scientists, business consultants, IT and Big Data managers) provided very positive feedback about the platform usability. Moreover, use cases 2 and 3, as mentioned previously, were also validated by the corresponding business processes employees, being able to extract the results by themselves.
Last but not least, it is important to highlight that those results should be applicable to any other financial entity that faces the same challenges and tries to overcome the limitations of data privacy regulation, the common lack of agility of large-scale on-premise Big Data infrastructures and very rigid but necessary security assessment procedures.
The digitalisation of the financial sector and the exploitation of the incredible amount of sensitive data collected and generated by the financial entities day by day makes their Big Data infrastructure very difficult to manage and to be agile in integrating innovative solutions. I-BiDaaS integrated platform provided a solutionto manage it in a much more friendly manner and makes Big Data analytics much more accesible to the bank employees with less technical and data science knowledge. It also explored ways to reduce the friction between data privacy regulation and the exploitation of sensitive data for other purposes, showcasing it in several use cases on enhancing an entity’s cybersecurity and preventing fraud toward their clients.